Difference between revisions of "Poll Results"
From Billy Meier
| Line 1: | Line 1: | ||
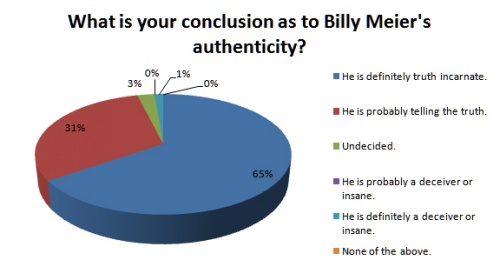
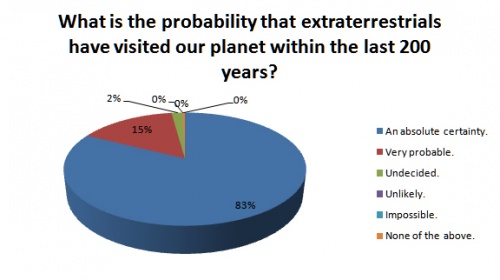
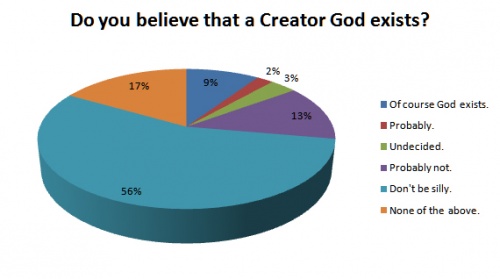
| − | To read the 3D pie charts correctly always presume that the dark blue segment begins at the top of the pie. This dark blue segment also corresponds to the top answer listed to the right side of each pie. | + | To read the 3D pie charts correctly always presume that the dark blue segment begins at the top of the pie. This dark blue segment also corresponds to the top answer listed to the right side of each pie. The same colours are used for all pies and are in the same order going clockwise around the pie from the top. |
==Poll 1 - 6th March 2010 to 6th April 2010== | ==Poll 1 - 6th March 2010 to 6th April 2010== | ||
Revision as of 16:32, 6 April 2010
To read the 3D pie charts correctly always presume that the dark blue segment begins at the top of the pie. This dark blue segment also corresponds to the top answer listed to the right side of each pie. The same colours are used for all pies and are in the same order going clockwise around the pie from the top.
Poll 1 - 6th March 2010 to 6th April 2010
- Number of participants: 234


